Wildcard Timing

Today, I finish my post-season series of research articles with a detailed look at wildcards (the main ones). In this article, you’ll find a gazillion of different charts, notes, observations, as well as a hall of fame and a hall of shame with the best and the worst wildcarders of the season. This article is pretty huge, so be careful. Opinions and critical remarks are welcome 😉

Wildcard Timing in FPL Overall

When do FPL teams normally play their main wildcards?

WC FPL

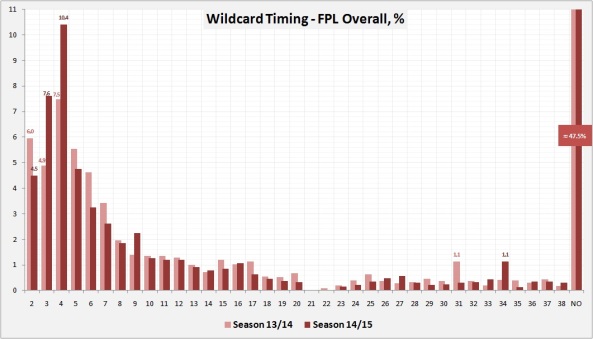
A brief look at the times when main wildcards were played in FPL during the last two seasons suggests that wildcard timing doesn’t change much from season to season. Which particular gameweeks are most popular depends on season fixtures, but the general picture remains the same:

  • Almost every second FPL team doesn’t play its wildcard at all (47.5% of teams in both seasons);
  • Most wildcards are played during the starting spell of a season;
  • Out of those who play their wildcards, the vast majority do so during the first season half (88% in season 14/15 and 86% in season 13/14).

Theoretically, if wildcards were completely irrelevant to success in FPL, this picture wouldn’t change significantly across the overall rankings. Wildcards are not irrelevant though and are correlated with success in FPL for two primary reasons:

  • they directly contribute to the final point tally by letting a FPL manager save on the points that he might  otherwise spend on extra transfers to change a bulk of his team;
  • they reflect to a certain extent the level of skills and diligence shown by a FPL manager as more skilled and diligent managers are less likely to waste their wildcards by not playing them at all, playing them badly, or at a bad moment.

Continue reading

Transfer Activity: Abstinents and Wheeler Dealers

My articles on the final top 1K and top 10K teams made me wonder if there is indeed some ‘optimal’ range for the number of transfers that we should strive for to achieve the highest possible overall rank. In this post, I take a look at transfer policies of the top 100,000 teams and see how transfer activity was associated with the final rank on a larger scale.

Total Number of Transfers for top 100K FPL Teams

The winner 14/15 scored 2,470 points, a team with a top 100K rank scored 2,058 points. Here is how transfer activity varied for this range of points:

Top 100K - Number of TransfersFor each amount of total points scored, this chart shows average, minimum, and maximum numbers of transfers. The 5th and 95th percentiles correspond to the amount of transfers so that 5%  and 95% of the teams made fewer transfers.


  • The average number of transfers shows little variance and remains stable at roughly 43-44 transfers, although it slightly decreases towards the right.
  • As we go down the rankings, there is more diversity in transfer activity. The spread between the 5% of the teams with the most transfers and the 5% with the least transfers expands, so does the spread between the minimum and maximum numbers of transfers.
  • At the 2,097 points mark, the minimum number of transfers is 0. Is this the highest ranked dead team? Nope, it’s a fake dead team which made 0 transfers but played both wildcards (what a weird way to play FPL 😀 ). The actual highest ranked dead team has got 2,043 points and finished at rank 121,629. That’s without Hazard or Sanchez, but with the front line of Aguero(c), Austin, and Harry Kane as a third sub. Yes, it did get those 18 points vs Chelsea 🙂

To get another perspective, let’s consider how transfer policies in top 100, top 1K, top 10K, and top 100K differed from one another.

Continue reading

Season 14/15 – Final Top 1,000 Teams

For those interested in the very elite of FPL, here is another season summary focusing on the final top 1K. It contains similar analysis as the top 10K study published earlier except for one extra table. The final top 1K teams of season 13/14 were examined here.

Top 1K History Pages

History Pages of TOP 1K Teams 2014/15
# 0 1 2 3 4 5 6 7 8 TOTAL
Number of previous seasons 31 89 111 138 149 138 119 99 126 1,000
% 3.1% 8.9% 11.1% 13.8% 14.9% 13.8% 11.9% 9.9% 12.6% 100%
Previous top 10K finishes 507 255 124 70 33 7 4 0 0 1,000
% 50.7% 25.5% 12.4% 7% 3.3% 0.7% 0.4% 0% 0% 100%
Previous top 1K finishes 855 108 32 5 0 0 0 0 0 1,000
% 85.5% 10.8% 3.2% 0.5% 0% 0% 0% 0% 0% 100%
  • All the conclusions made in the top 10K study apply to the top 1K too: this season was the one for the experienced FPL managers. Fewer teams with 2 or less seasons on their history pages, fewer players without a top 10K or a top 1K finish in the past.
  • 31 teams managed to get into top 1K for a second season in a row. Just 2 teams accomplished 3 successive top 1K finishes: AFC Chenkooey by Sean Creamer and Divine Mercy ✝ ★★★★★ by Matthew Martyniak.

Continue reading

Season 14/15 – Final Top 10,000 Teams

In this post, I take a look at the final top 10,000 teams of this season in a similar manner to season 13/14.

Top 10K History Pages

Let’s start our acquaintaince with the best teams with a background check:

History Pages of TOP 10K Teams 2014/15
# 0 1 2 3 4 5 6 7 8 TOTAL
Previous seasons 398 1,005 1,185 1,550 1,409 1,250 1,065 926 1,212 10,000
% 3.98% 10.05% 11.85% 15.50% 14.09% 12.50% 10.65% 9.26% 12.12% 100%
Previous top10K finishes 6,406 2,076 893 377 169 59 17 3 0 10,000
% 64.06% 20.76% 8.93% 3.77% 1.69% 0.59% 0.17% 0.03% 0% 100%
Previous top1K finishes 9,179 683 121 17 0 0 0 0 0 10,000
% 91.79% 6.83% 1.21% 0.17% 0% 0% 0% 0% 0% 100%
  • Experience mattered a lot this season, much more in comparison with last season. Successful novices accounted for just 4% of the final top 10K, 26% of the teams had no more than 2 years of experience behind them. That’s a pretty big drop compared to last season’s respective values of 9% and 40%.
  • The amount of teams without a single top 10K finish in the past has declined by 15.2 percentage points. Could this be down to the fact that the amount of such teams in FPL has increased by 7,925 teams that made their first top 10K finish last season? Doesn’t look so. Only 1,022 teams, or 10.2%, have managed to finish in top 10K for a second season in a row. Being successful in the past was a more important factor this season as well.

Continue reading

FPL Discovery Stats Summary 2014/2015

The season is over, the dust has settled, which can only mean one thing – the time has come to unleash my inner nerd and do some number crunching 🙂

Today, I start the series of post-season reviews with the summary of all the stats that appeared in my blog during the season. This summary is now available from the menu above.

Although it’s been the second season for me running this blog, for the first time my regular posts covered an entire season: I started my blog only in GW12 last season. Even though the last season data were not complete, I tried to compare stats from this season with last season numbers where appropriate and to see in what ways this season was different.

The most significant changes happened with respect to wildcard timing, team values, and turnover of teams up top:

  • This season, more teams managed to perform well during its first half without using their wildcards and all those saved wildcards came in handy during the final part. No wonder that among the final top 50 players 35(!) played their wildcards late. Last season, wildcards were pretty useful for final gameweeks as well, but getting to the top 10K without playing them in the first half of the season was problematic.
  • FPL has changed their algorithm for price changes, and consequently team values were nowhere near as high as they were a season ago.
  • Even though this season was lower scoring compared to the previous one, the gaps between top teams were wider. As a result, top 10K turned into a more closed club with a smaller turnover of teams in there.

I elaborate on all these conclusions and many others in this summary. Graphical evidence abounds. Take a look.